What Cascade does · THD
THD vs frequency and level
THD vs Frequency
What it shows. Distortion across the audio band at a fixed level, as a curve from 20 Hz to 20 kHz.
The theory. At each frequency the analyzer notches out the fundamental and measures what remains: THD+N. A clean device gives a low, flat line. Rises at the ends show where it struggles. The app settles before each reading, so the first point does not spike.
Operating it. Set INPUT, OUTPUT LEVEL, START, STOP, POINTS and UNIT (dB or %). Tick CH B to add Channel B, which roughly doubles the time because the analyzer measures one channel at a time. Press RUN SWEEP.
Status. Hardware-verified: flat −87.9 dB from 20 Hz to 20 kHz at −20 dBV. The generator's residual floor reads −110 to −113 dB in Cascade, matching APWIN's own export.
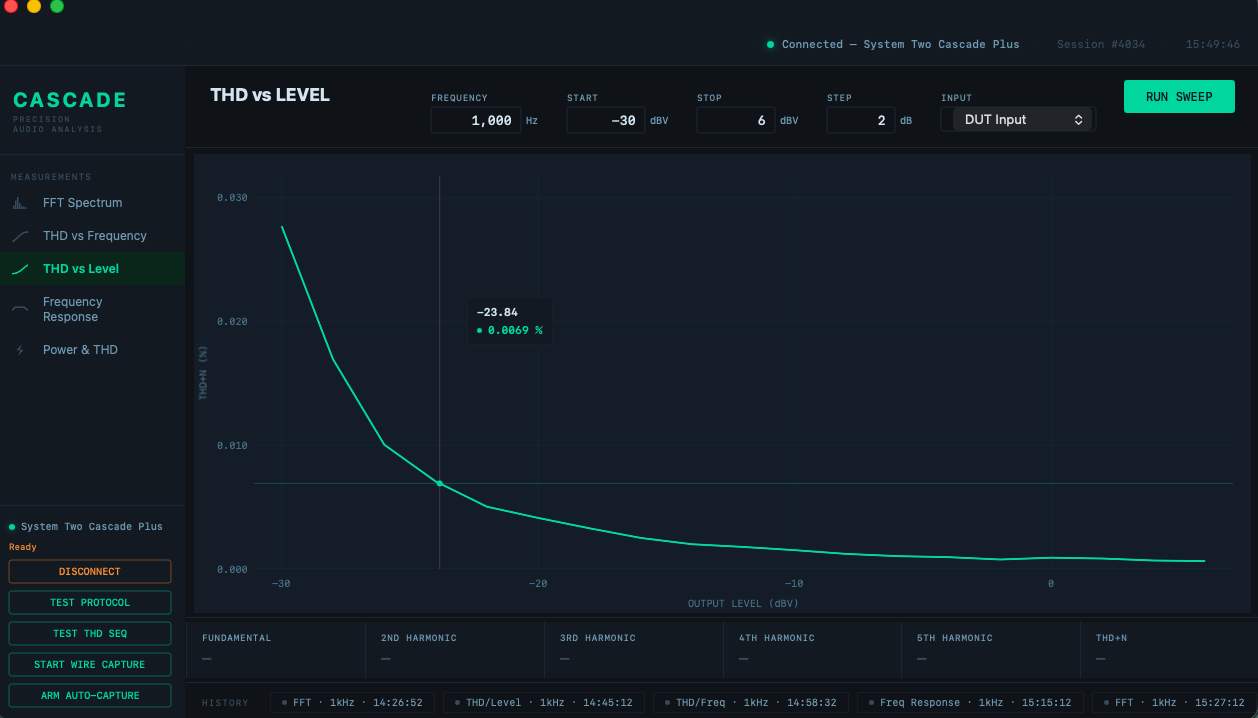
THD vs Level
What it shows. Distortion against drive level at one frequency, the curve that shows where a device leaves its clean region and starts to clip.
The theory. At low levels, noise dominates THD+N, so the curve falls as level rises. At some point the device's own distortion takes over and the curve turns up. The lowest point is the device's sweet spot. On the first run the curve was the textbook shape: 0.014 % at −30 dBV falling to 0.0007 % at +6 dBV.
Two deliberate rules. A level the generator cannot produce leaves a gap in the curve rather than a substituted point, because a substituted point cannot be told apart from data. And the X axis in volts or watts comes from the measured output, not the commanded level.
Operating it. Set FREQUENCY, START, STOP, STEP, X AXIS (dBV, Vrms or W), LOAD (for watts), UNIT and optionally CH B. STOP AT THD % halts the climb when distortion passes a limit and drops the generator back to the lowest level. It protects the DUT only because the sweep rises. Press RUN SWEEP.
Status. Hardware-verified over −50 to +22 dBV. The abort limit was tested into a small RIAA inverse filter on a rising sweep. The watts axis and load conversion are unverified: they need an amplifier, which has not been connected.